Case study · Enduro
Enduro, from the bike's point of view
In enduro, timing tells you how fast and a rider's tracker tells you where. We fitted a second unit to the bike on two enduro days, a tight EnduroCross-style track and a long hard enduro loop, to see what the bike itself could tell riders and teams.
- Discipline
- Enduro: short track and hard enduro
- Riders
- 2, one day each
- Kit
- Rider-worn tracker + bike-mounted unit
- Recorded
- 27 hits with traces, 23 harsh events, bike voltage
01 The challenge
The hardest moments in enduro happen where nobody is watching
A big landing in a rock garden, a climb fought metre by metre, the same jump hit lap after lap. Timing gives the result and a rider's tracker gives the route, but neither says what the bike went through, or where. We wanted to measure it.
02 The setup
Two units: one follows the rider, one records the bike
Each rider wore our tracker as usual. Each bike also carried a unit wired to the bike's 12 V supply. This is what each one sent to the platform on the two days.
03 The two enduro days
A tight 320 m track and a 16.6 km mountain loop
Opposite ends of enduro: short, repeated laps over obstacles, and hours on a technical route with long climbs.
Rider A · Short track
An EnduroCross-style track day
- Sessions
- 4
- Timed laps
- 12
- Best lap
- 66.2 s
- First lap to best lap
- 110.6 → 66.2 s
- Distance on track
- 6.6 km
- Top speed
- 30 km/h
Rider B · Hard enduro
One loop of a marked enduro route
- Loop time
- 3:14:36
- Distance
- 16.6 km
- Climbing
- ≈790 m
- Riding / stopped
- 64 / 128 min
- Stops
- 7
- Top speed
- 76 km/h
04 What we found · Short track
18 hits over 6 g in one day, all at the same three spots on the lap
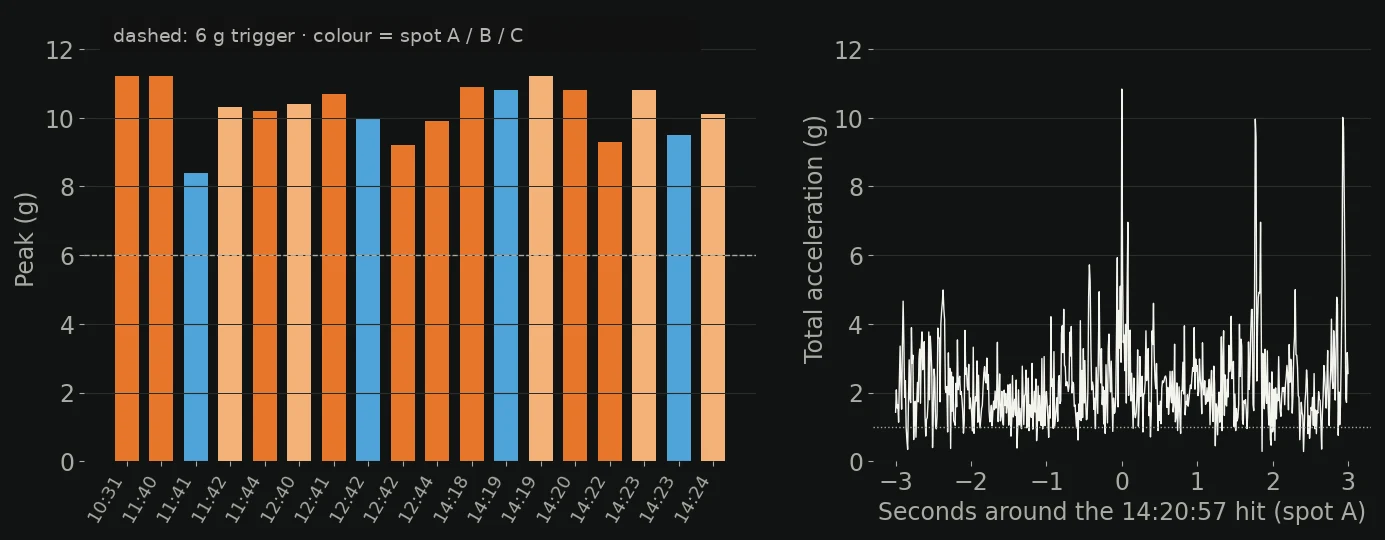
8.4–11.2 g
- Spot A: 9 hits, 9.2–11.2 g
- Spot B: 5 hits, 10.1–11.2 g
- Spot C: 4 hits, 8.4–10.8 g
- Between hits, the bike shakes at 1–4 g
The same spots, lap after lap: the hits show which parts of the track are hardest on the bike, and each trace shows how that landing went. Over the day the rider's lap time came down from 110.6 s to 66.2 s.
05 What we found · Hard enduro
9 hits in the first 26 minutes, up to 10.3 g. Most of the loop was ridden near 1 g.
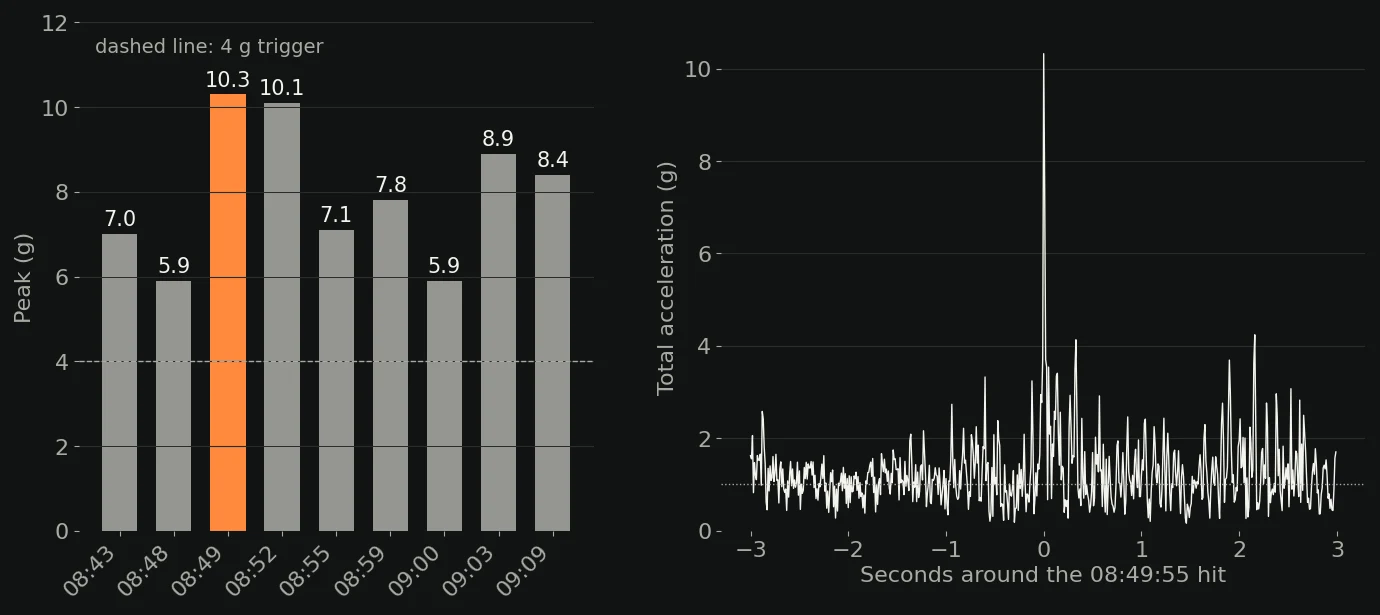
10.3 g
- The biggest hit, at 23 km/h
- Under 2.5 g for 90 % of the riding
- Each hit above 4 g for 0.03–0.76 s
The trigger started at 4 g and was raised to 6 g remotely after 26 minutes. No hit crossed 6 g for the rest of the loop.
Hard-acceleration events, plus one hard-braking event, over the loop
Of those events on one climb, after the fourth stop: where the rider fought for grip
The lowest voltage with the engine running. Parked, it never went above 13.26 V, so the bike's own voltage shows when it ran
06 Getting the data off the bike
94 % of bike positions on the map within 10 seconds on the short track
Typical time from the bike unit recording a position to it showing on the map, short track
Of the bike unit's positions live within a minute on the hard enduro loop, where it sent in batches
Of the rider's tracker positions live within a minute on that same loop
07 What it means for enduro
Run the bike unit with the rider's tracker, not instead of it
The bike unit adds
- Every hit: peak g, place and a 100 Hz trace
- Harsh acceleration and braking, on the map
- Bike voltage, charging and engine-on time
- 1–2 s positions for laps and sectors
- Power from the bike, not a battery
The rider's tracker stays for
- The rider, when rider and bike part
- The SOS button
- Its own battery, whatever the bike does
- The quicker live feed on the hard enduro day
What we tune per discipline
- The sensor tops out at 8 g per axis: 6 of the 18 short-track hits reached it
- The hit trigger: 4 g fired 9 times in 26 minutes on the hard enduro loop
- How often the bike unit sends, for live use
The rider's tracker finds the rider. The bike unit explains the ride.
Two real enduro ride days in 2026. Riders, venues and dates are not named. All figures come from the platform's recorded data for those days. G-force is the total across the three axes; a hit is the bike unit's impact event over its trigger.